


Partner Performance Dashboard #
Successful Channels offers a wide range of PPD metrics that can help in the performance review of a partner. By diagnosing the partner data and populate that data in tables and creating charts based on the data received.
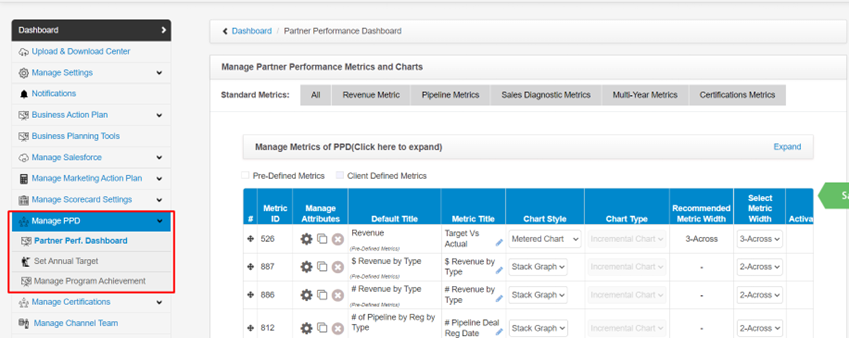
Where to find Partner Performance Dashboard in Admin #
- Go to admin.
- Enter username and password
- Select Manage PPD > Partner perf. Dashboard.
- You are now on the partner performance dashboard page.
Types of Partner Performance Metrics #
Successful Channel offers 5 types of PPD metric that can be used to diagnose the opportunity data of the partners. Each category have one or more metrics
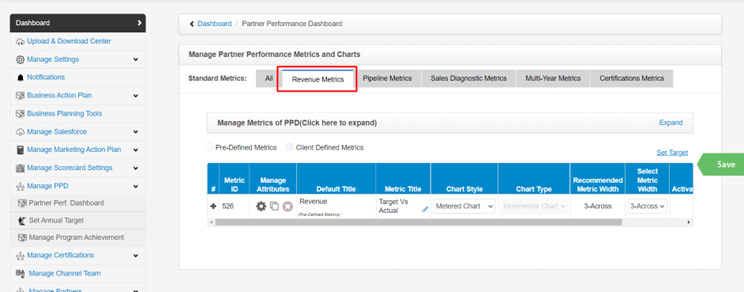
- Revenue Metrics – The metric only populates the result for all the deals with the sales/pipeline stage “Closed Won”.
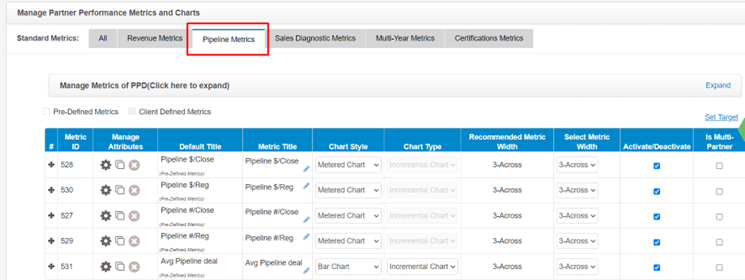
- Pipeline Metrics – The metric populates the result for all the deals for all the sales/pipeline stage for a deal based on the deal life cycle.
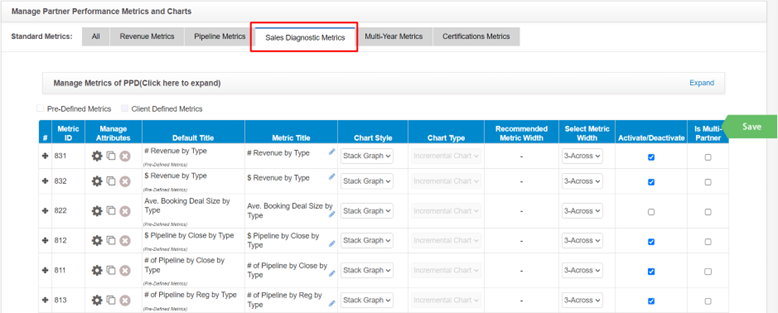
- Sales Diagnostic Metrics – The metrics under this category can be used to populate the result based on any deal attribute.
- Multi-Year Metrics – The metrics under this category can be used to populate the result for a single deal attribute value at a time by fiscal year and compare the result with previous fiscal year result for the same attribute value.
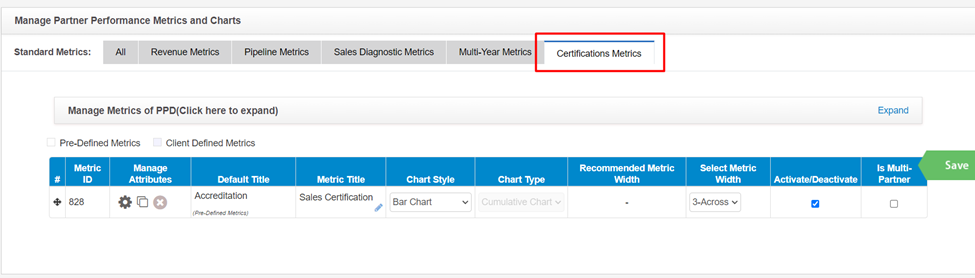
- Certifications Metrics – The metric populates the result based on the certifications issued to the partner contact. The metric chart displays the result based on the certification “Issued Date”

Revenue Metrics #
- Go to dashboard.
- Enter username and password.
- Select Manage PPD > Partner perf. Dashboard > Revenue Metrics.
Pipeline Metrics #
- Go to dashboard.
- Enter username and password.
- Select Manage PPD > Partner perf. Dashboard > Pipeline Metrics.
Sales Diagnostic Metrics #
- Go to dashboard.
- Enter username and password.
- Select Manage PPD > Partner perf. Dashboard > Sales Diagnostic Metrics.
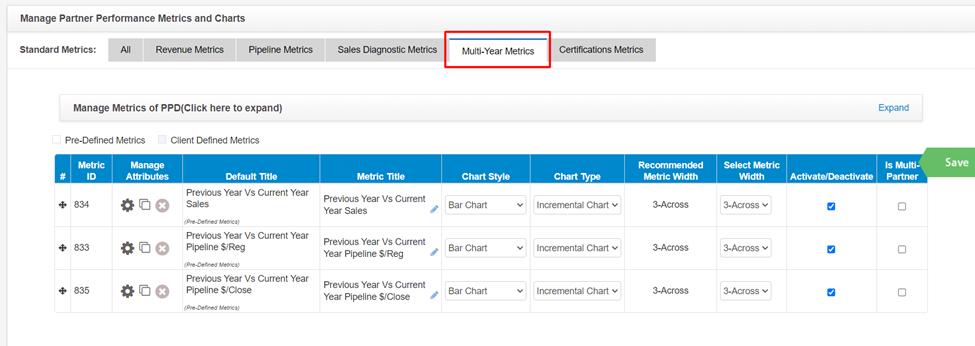
Multi-Year Metrics #
- Go to dashboard.
- Enter username and password.
- Select Manage PPD > Partner perf. Dashboard > Multi-Year Metrics.
Certification Metrics #
- Go to dashboard.
- Enter username and password.
- Select Manage PPD > Partner perf. Dashboard > Certification Metrics.
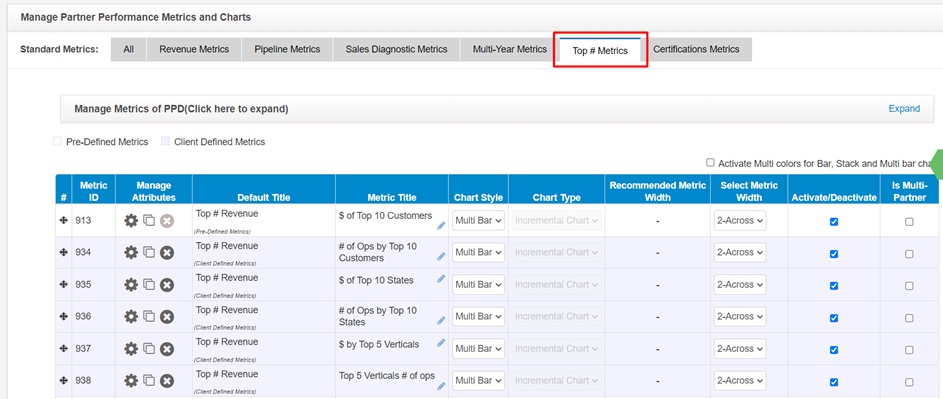
Top # Metrics #
- Go to dashboard.
- Enter username and password.
- Select Manage PPD > Partner perf. Dashboard > Top # Metrics.
Configure your PPD Metrics #
Configuring the PPD metrics is very easy. Follow the below steps to configure you pipeline and revenue metrics.
Step 1: Configure Metrics Title and Description #
Configuring revenue and pipeline metrics are similar.
- Go to dashboard.
- Enter username and password.
- Select Manage PPD > Partner perf. Dashboard > Metric.
- Click on gear icon to open a pop-up where the metric(s) can be configured.
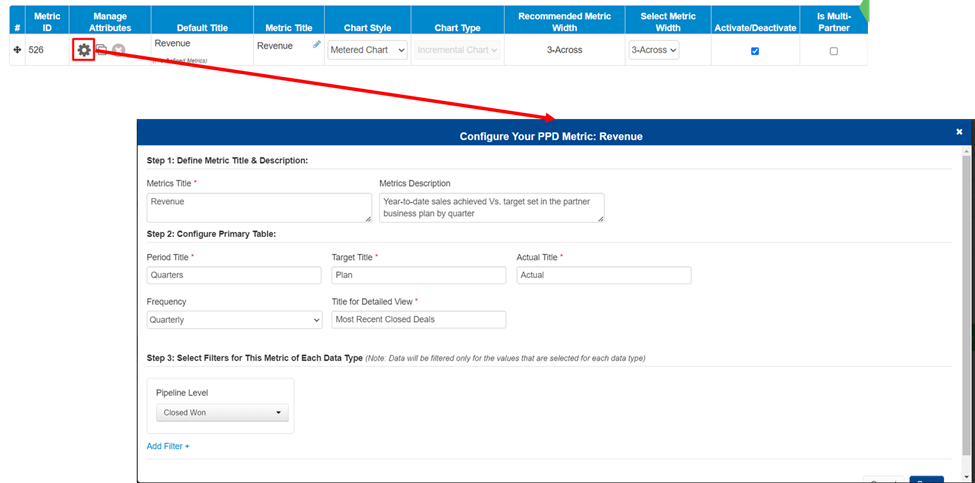
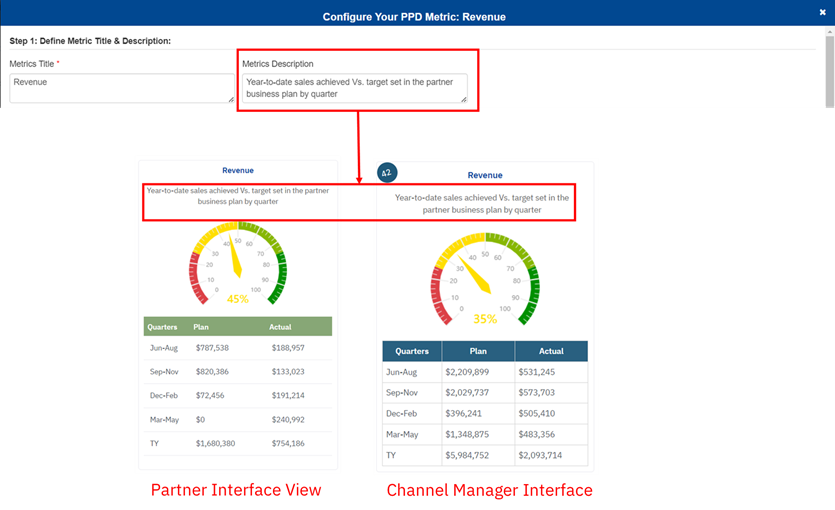
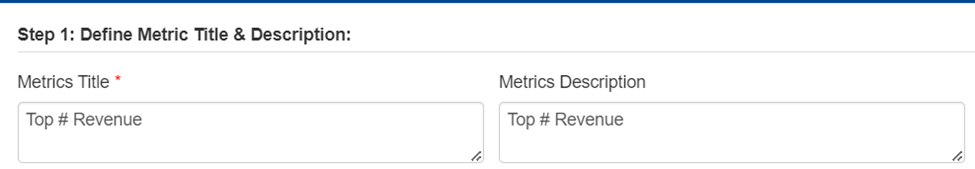
5. Enter Metric Title. For each of the metric client can set title that can be easily relate with their partners/channel managers avoiding any confusion. The character limit for the titles are 30 characters.
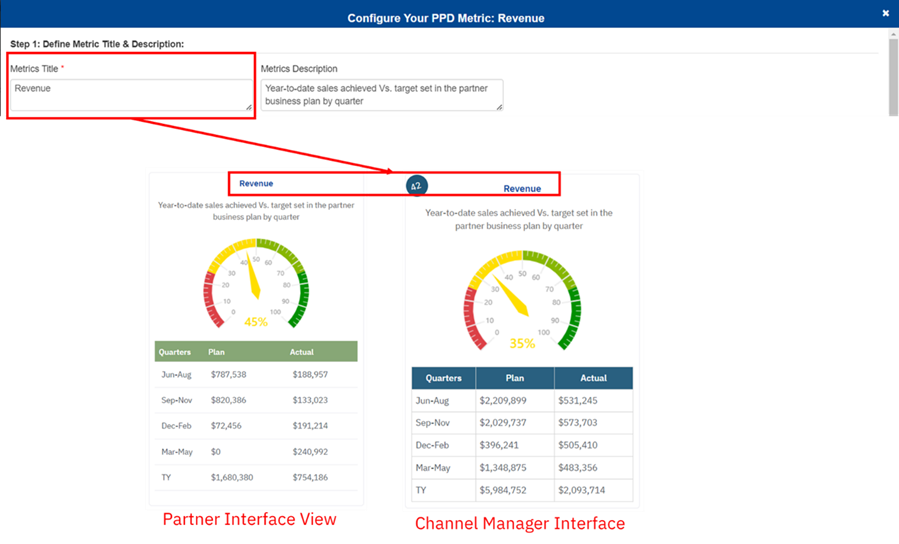
6. Enter Metric description. For each of the metric client can set description that can explain what data is displaying in the metric. The character limit for the description is 300 characters.
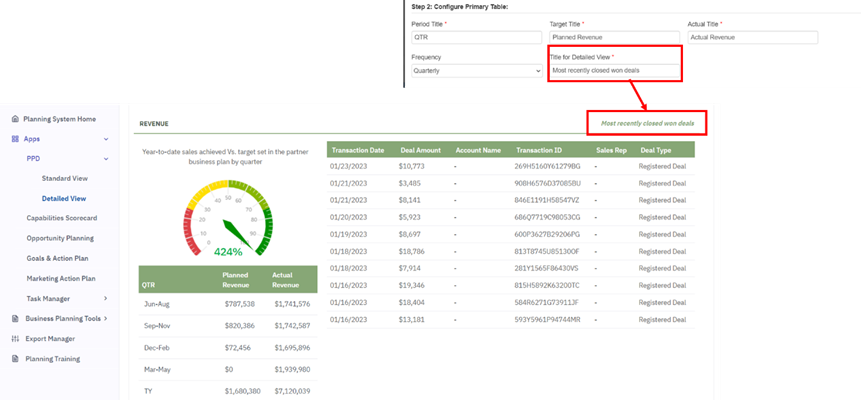
Step 2: Configure Primary Table #
- Follow step 1-4 (Step 1: Configure Metrics Title and Description)
- Enter details for primary table. The configuration of primary tables only impacts the metrics that are listed under the Revenue Metrics, Pipeline Metrics, Multi-year Metrics and Certification Metrics and some of the sales diagnostic metrics (# Active reps Closing/Registering Deals, Win Rate, Cycle Time).
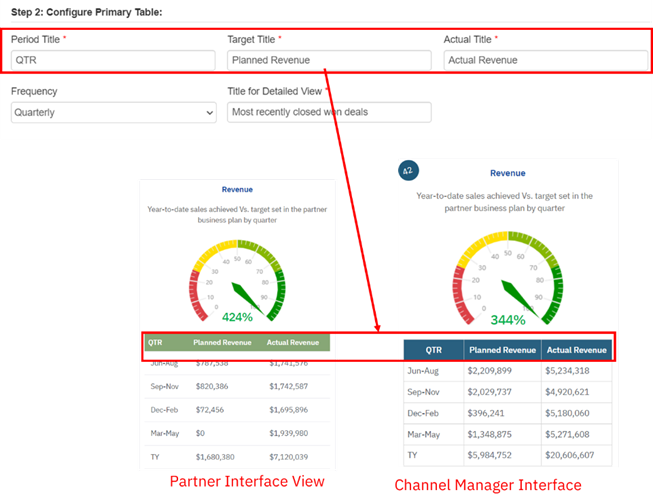
- Enter period title. Enter title which is more relatable to your team.
- Enter target title. Enter title which is more relatable to your team.
- Enter actual title. Enter title which is more relatable to your team.
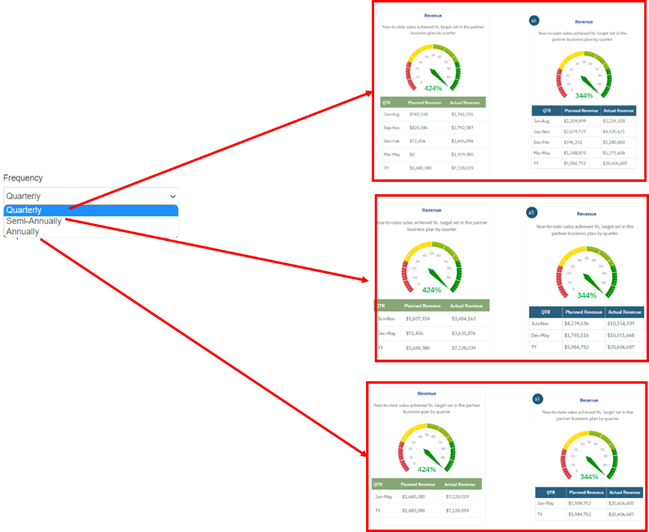
- Select frequency. This action changes the period segregation for the metrics.
- Title for the detailed view. The titles for the detailed view display in the partner interface only.
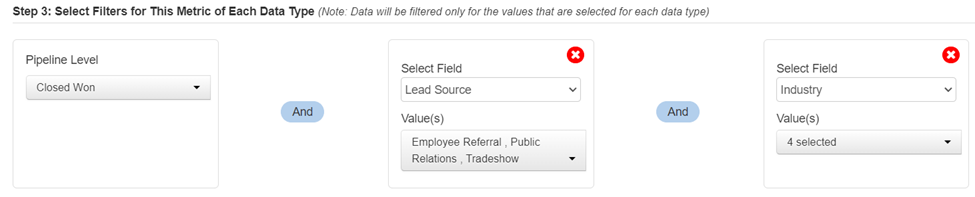
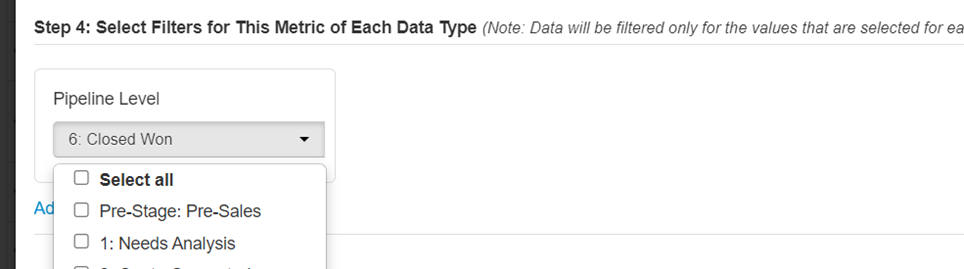
Step 3: Select Filters for this Metric of Each Data Type #
The filter settings will allow the client to display the rollup based on the focused attribute values if needed in the partner interface and channel manager interface. The filters can only be set on the attribute type List (with operator Equals Only) or Text (with operator Contains Only).
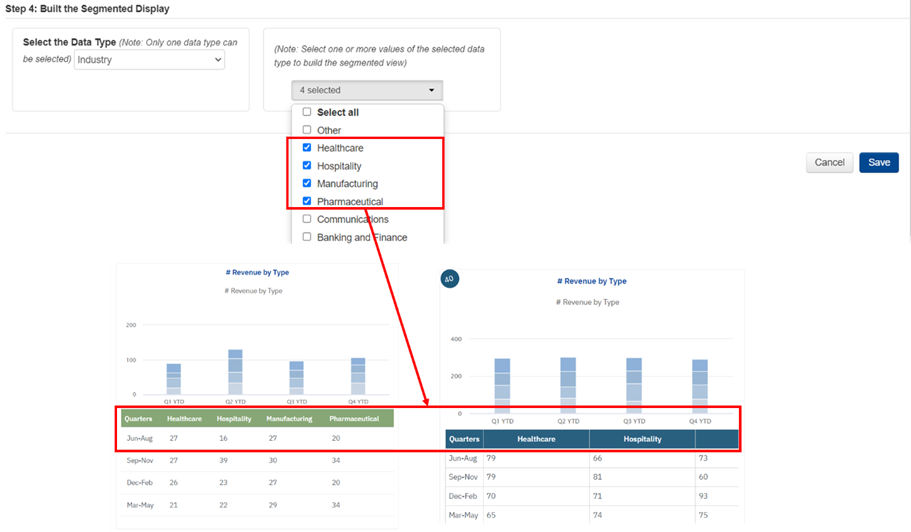
Step 4: Build the segment display. #
This step only appears in Sales Diagnostic metrics. As the attributes value selected in the segment will create the metric display view in Partner/Channel manager interface.
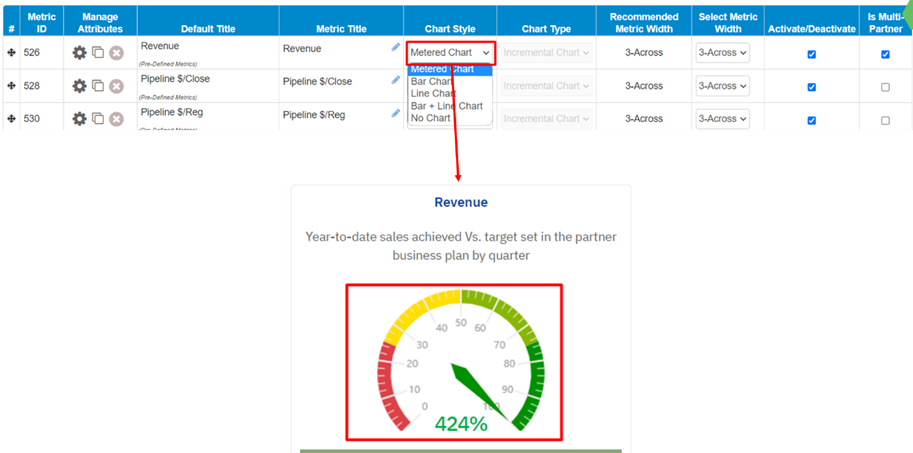
Metrics Chart Styles #
Meter Charts #
The metered charts can only be selected for Revenue and pipeline metrics
- Follow step 1-3 (Step 1: Configure Metrics Title and Description)
- Select chart style.
Bar Charts #
- Follow step 1-3 (Step 1: Configure Metrics Title and Description)
- Select chart style.
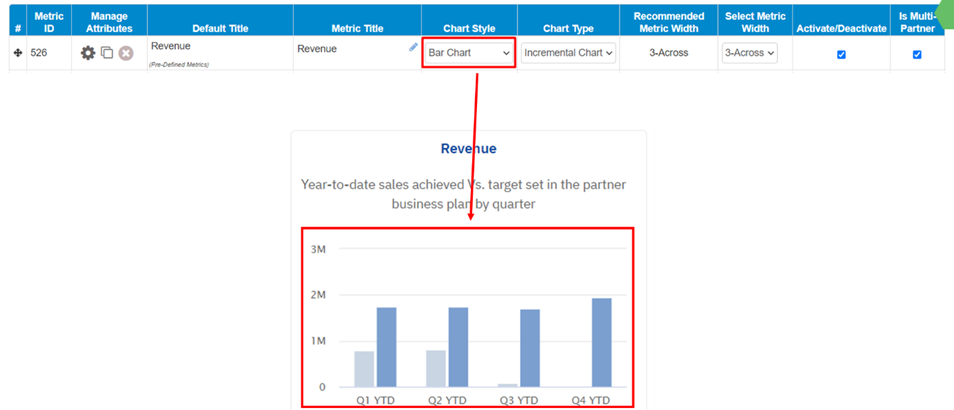
- PPD metrics that supports Bar Charts
- Revenue Metrics
- Pipeline Metrics
- # Of Active Reps Registering Deals (Sales Diagnostic Metrics)
- # Of Active Reps Closing Deals (Sales Diagnostic Metrics)
- Win Rate Metric (Sales Diagnostic Metrics)
- Cycle Time Metric (Sales Diagnostic Metrics)
- Multi-Year Metrics
- Certification Metrics
Line Charts #
- Follow step 1-3 (Step 1: Configure Metrics Title and Description)
- Select chart style.
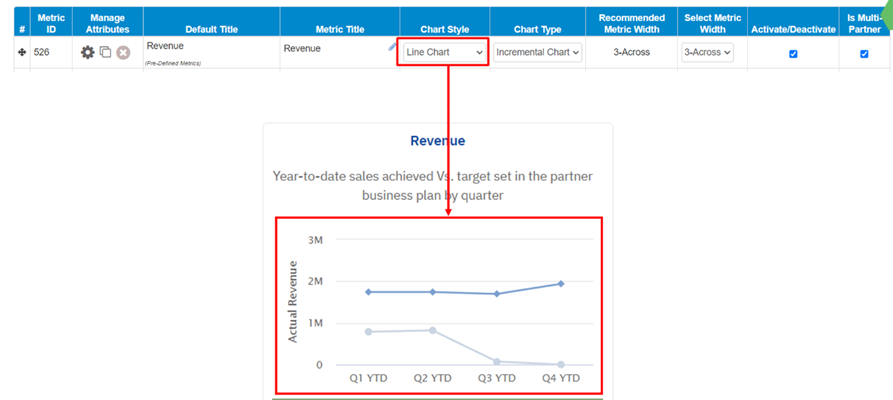
- PPD metrics that supports Line Charts
- Revenue Metrics
- Pipeline Metrics
- # Of Active Reps Registering Deals (Sales Diagnostic Metrics)
- # Of Active Reps Closing Deals (Sales Diagnostic Metrics)
- Win Rate Metric (Sales Diagnostic Metrics)
- Cycle Time Metric (Sales Diagnostic Metrics)
- Multi-Year Metrics
- Certification Metrics
Bar + Line Charts #
- Follow step 1-3 (Step 1: Configure Metrics Title and Description)
- Select chart style.
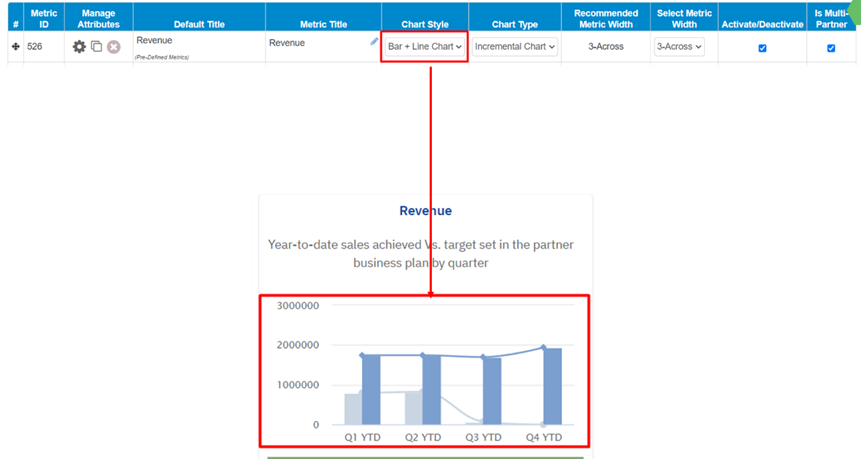
- PPD metrics that supports Line Charts
- Revenue Metrics
- Pipeline Metrics
- # Of Active Reps Registering Deals (Sales Diagnostic Metrics)
- # Of Active Reps Closing Deals (Sales Diagnostic Metrics)
- Win Rate Metric (Sales Diagnostic Metrics)
- Cycle Time Metric (Sales Diagnostic Metrics)
- Multi-Year Metrics
- Certification Metrics
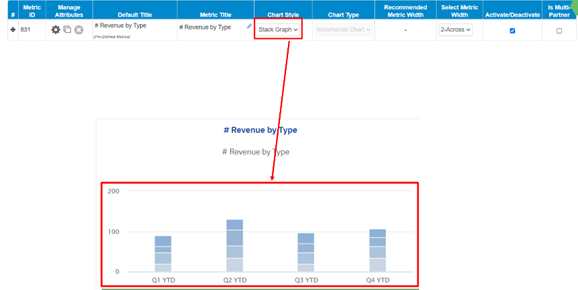
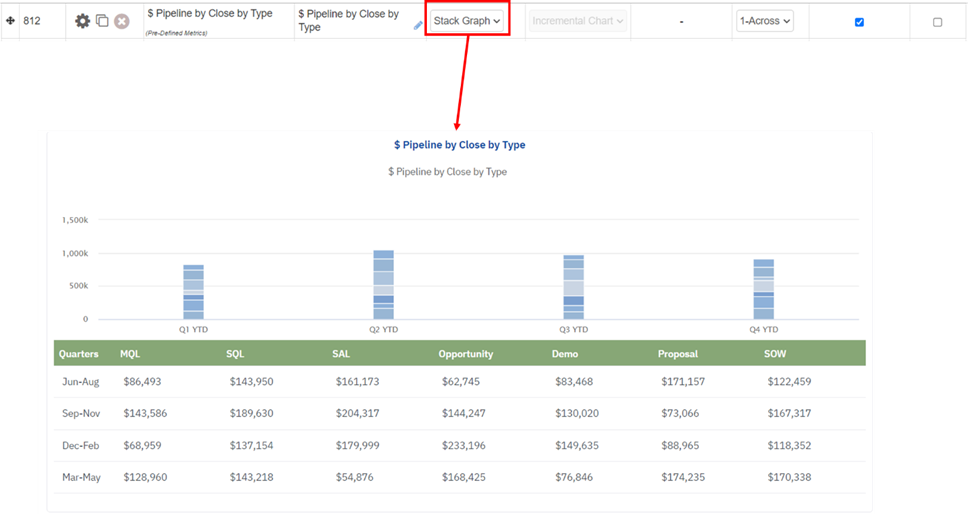
Stack Charts #
- Follow step 1-3 (Step 1: Configure Metrics Title and Description)
- Select chart style.
- All the metrics that contains “by type” in the metric title are eligible for stacked bar view.
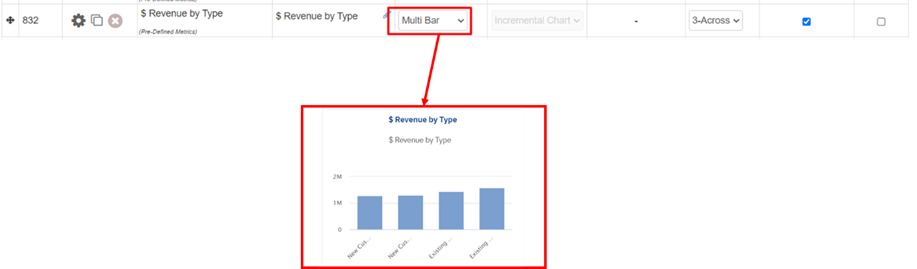
Multi-Bar Charts #
- Follow step 1-3 (Step 1: Configure Metrics Title and Description)
- Select chart style.
- All the metrics that contains “by type” in the metric title are eligible for stacked bar view.
Frequently Asked Questions #
What are revenue metrics? #
Revenue metrics display the sales data for the partners that have the status of “closed won”. Any PPD metric contains the text “Revenue” will display rollup of the closed won deals.
What are pipeline metrics? #
pipeline metrics display the sales data for the partners for any deal status (Sales Stage/Pipeline Level). Any PPD metric contains the text “pipeline” will display rollup of the active deals/closed won deals.
What are sales diagnostic metrics? #
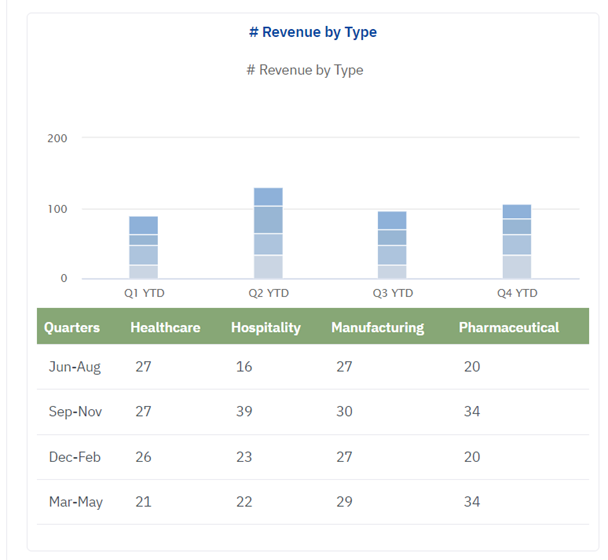
Metrics that comes under the sales diagnostic metric allow client to create a metric that can populate a rollup sum of deals by quarter, semi-annual or annual based on the attribute value selected in a metric. Simple example a client wants to know how many opportunities “Closed Won” are based on the Attribute “Deal Type” that has values “HealthCare, Hospitality, Manufacturing and Pharmaceuticals”. This detail can be gathered by using one of the sales diagnostic metrics. The below metric display the # of opportunities closed in each quarter for each of the attribute value.
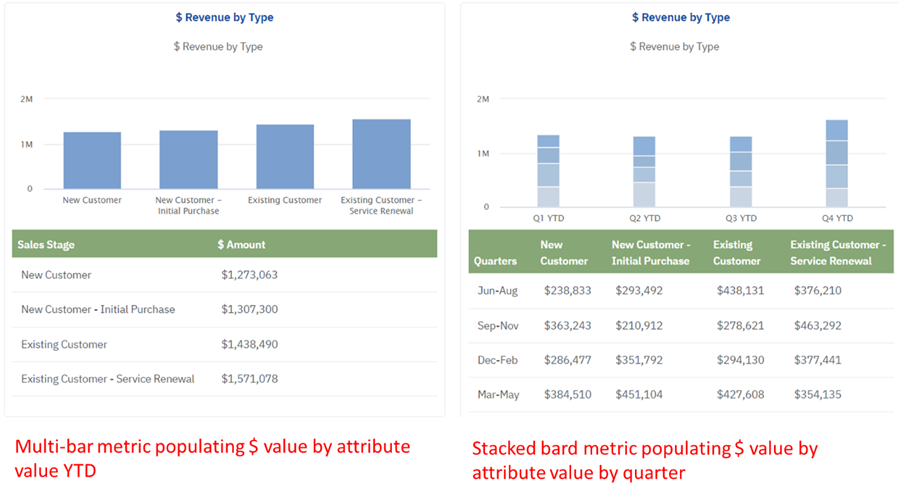
How data in Stacked based metrics is different for multi-bar based metrics? #
Stacked metrics can display the rollup sum of the attribute value by quarter, semi-annual or annual with a stacked bar view.
Multi-bar can display the rollup sum of the attribute value YTD in multi bar view for each of the attribute.
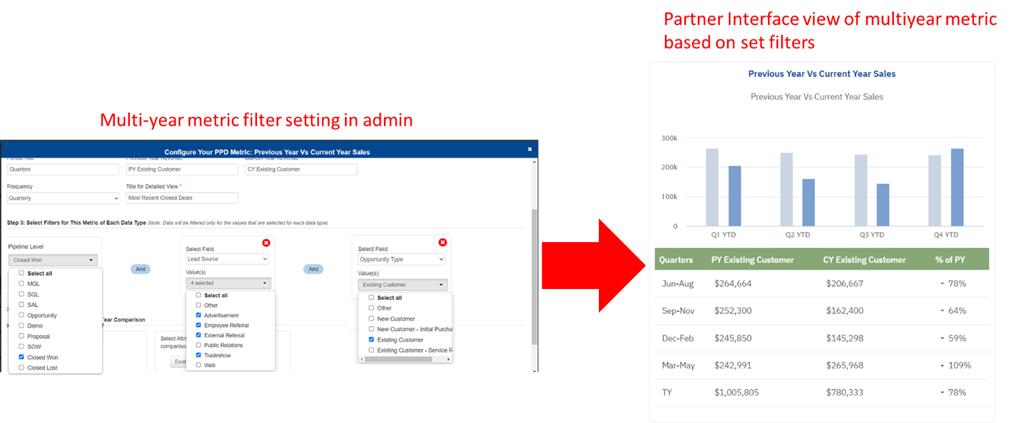
What are multi-year metrics? #
Multi-year metrics is a category of metrics that can be used to calculate the % increase/decrease of the attribute values.
The screenshot below displays a multiyear metric view in the partner/channel member interface. The metric is comparing the actual revenue previous year vs actual revenue of current year based on the filters set on the attribute in admin
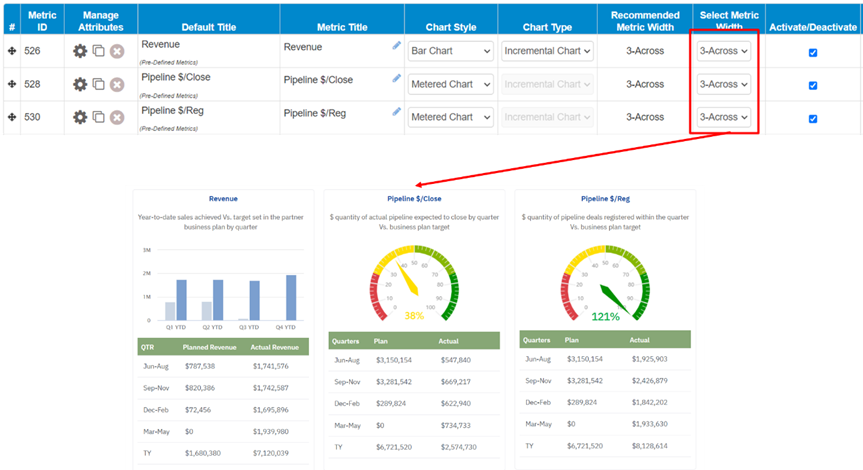
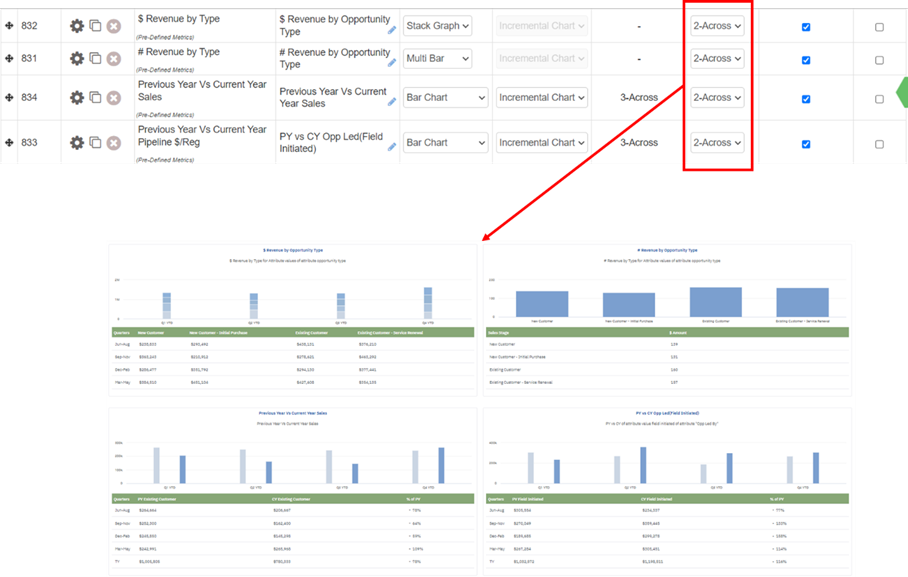
How to change the width of a metric? #
In admin client can change the width of any metric. PPD metrics offers three options to set the width of the metrics.
- 3-Across: In admin select the 3-Across option. 3 metrics with the similar options selected can display in a single row.
2. 2-Across: In admin select the 2-Across option. 2 metrics with the similar options selected can display in a single row.
3. 1-Across: In admin select the 1-Across option. Only 1 metric display in a single row.
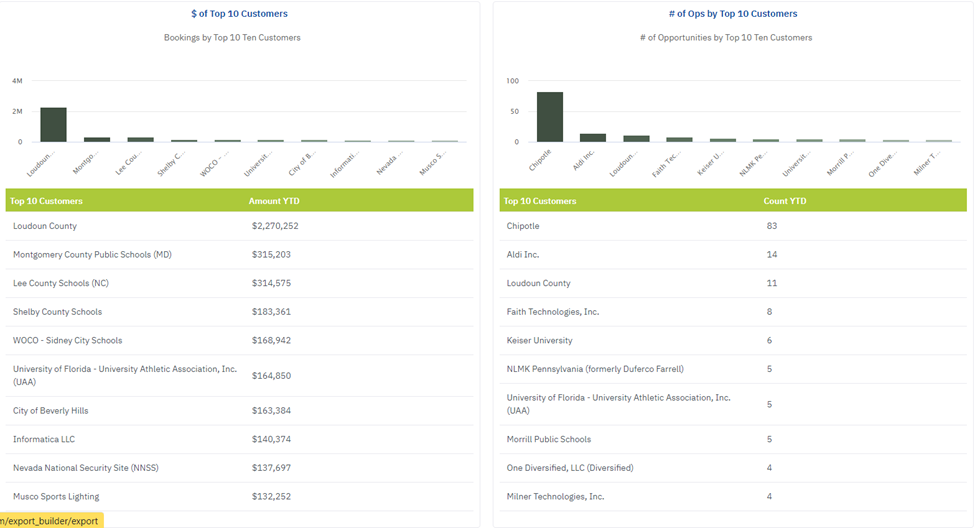
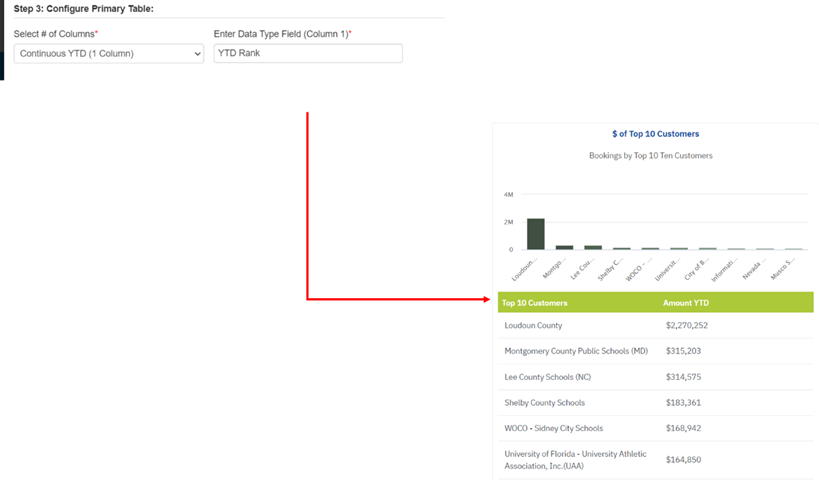
What are Top # Metrics? #
Top # metrics display the top results for the data type “Text or List”. The results are only limited to top 10. The top 10 results can be populated by “Amount by Deals YTD” or by “Quantity by Deals YTD”.
How to Configure Top # Metrics? #
- Go to dashboard.
- Enter username and password.
- Select Manage PPD > Partner perf. Dashboard > Top # Metric.
- Click on gear icon to open a pop-up where the Top # Metric(s) can be configured.
- There are 4 steps to configure the PPD metrics.
- Define Metric Title and Description
- Select attribute for Top # Ranking.
- Select Data Object: In top # metrics select the data category.
- Select Attribute: Select the attribute for which the top # result can be populate. This attribute can be of type Text or List
- Top # Rank Count: Select upto which rank the Top # metric should populate the result.
- How data displayed: This option is to populate result for the top 3 attributed by amount rollup or by # of deal counts.

- Configure primary table.
- Select # of Columns > Continuous YTD (1 Column).
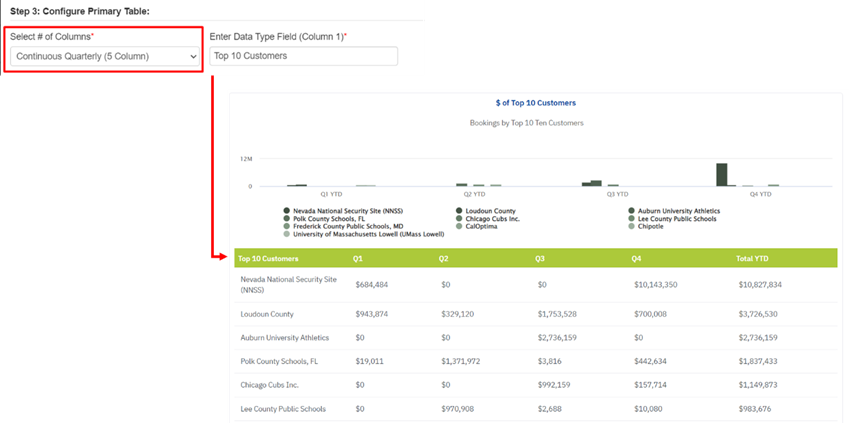
- Select # of Columns > Continuous Quarterly (5 Column).
- Select filters for this metric for each data type.
- Click “Save”
