


Overview #
The Planning System Log Report and Export Builder allows users to track and export planning system activities such as:
- New planning system entries
- Updates to existing entries
- Deletions of entries
- Page loads of planning system interfaces
- Data export actions
These reports can be customized, saved for reuse, and exported.
How to Access #
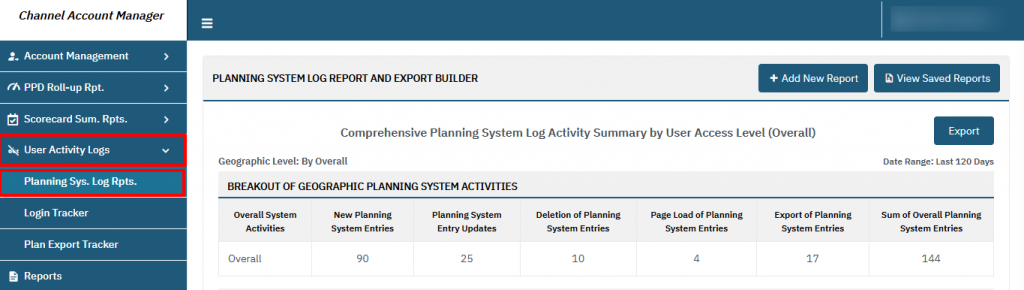
- Navigate to User Activity Logs > Planning Sys. Log Rpts. in the left-hand menu of the CAM dashboard.
- The main page displays the overall summary of planning system activities and the option to create or view saved reports.
Steps to Create a New Report #
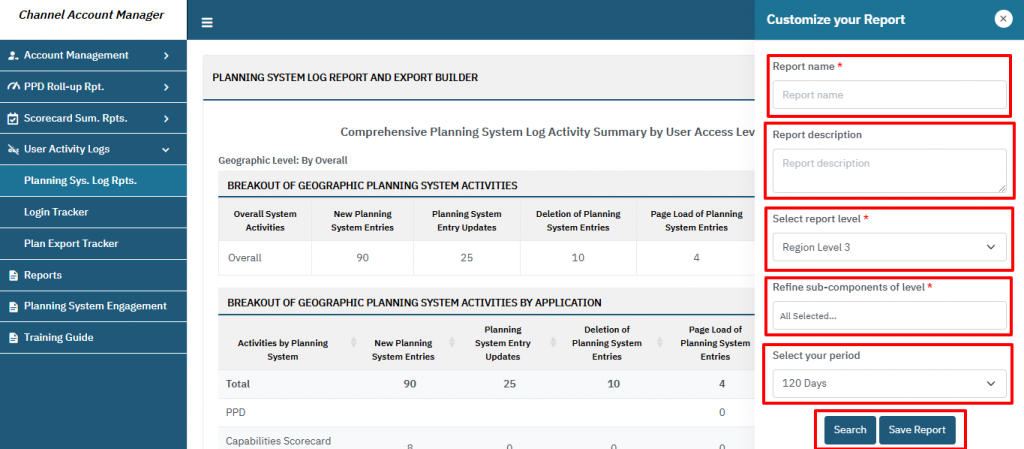
- Click “Add New Report”:
- Located at the top-right corner of the page.
- Customize Your Report:
- Report Name: Enter a title for your report.
- Report Description: Add details about the report’s purpose.
- Select Report Level: Choose a geographic or organizational level (e.g., Region Level 1/2/3, channel team member, partner account).
- Refine Sub-components of Level: Filter the data by specific regions, CAMs, or partners.
- Select Your Period: Define the time range for the report (e.g., 120 days).
- Generate the report:
- Click Search to generate the report based on the specified parameters.
- Save Report (Optional):
- Click Save Report to reuse the same report configuration in the future.
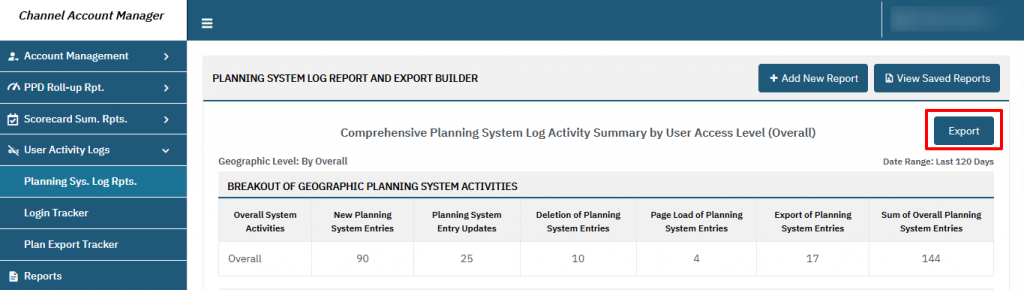
Export Report: #
- Click the Export button to download the report in Excel format.
Features of the Planning System Log Report #
Breakout of Geographic Planning System Activities #
- Displays activity summaries by geographic or organizational levels.
- Metrics include:
- Overall system activities
- New entries
- Updates
- Deletions
- Page loads
- Data exports

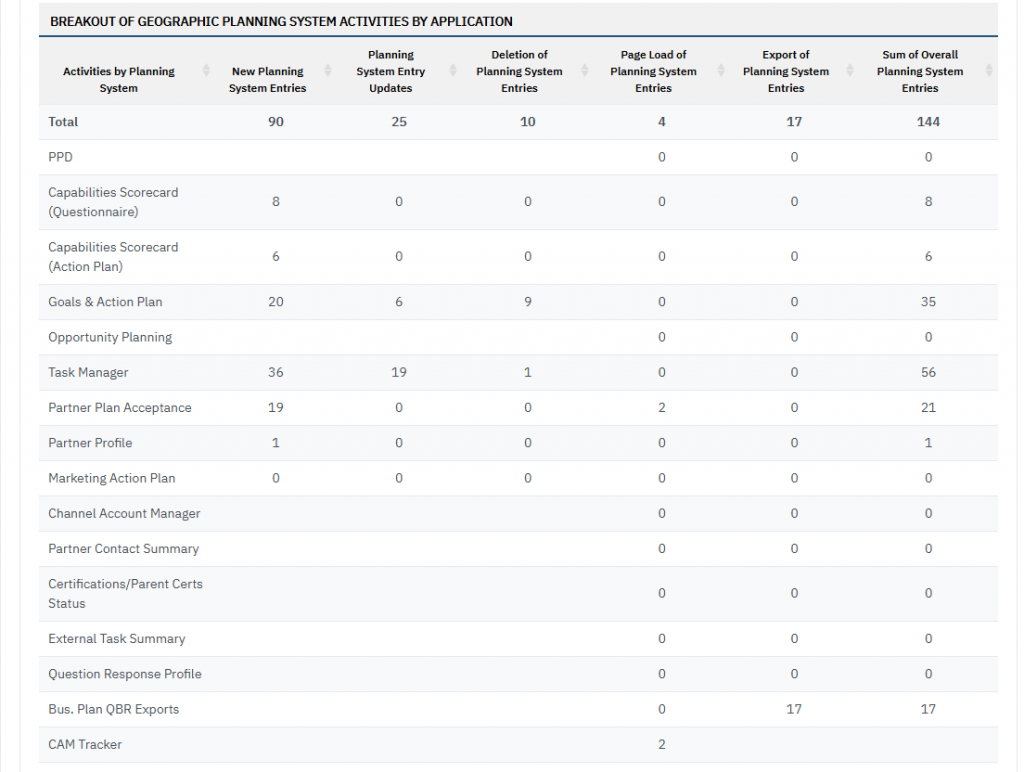
Breakout by Application #
- Tracks specific activities for individual applications, such as:
- PPD (Partner Performance Dashboard)
- Goals & Action Plan
- Task Manager
- Partner Plan Acceptance
- Marketing Action Plan, etc.
- Channel Account Manager
- Partner Contact Summary
- Certifications/Parent Certs Status
- External Task Summary
- Question Response Profile
- Bus. Plan QBR Reports
- CAM Tracker
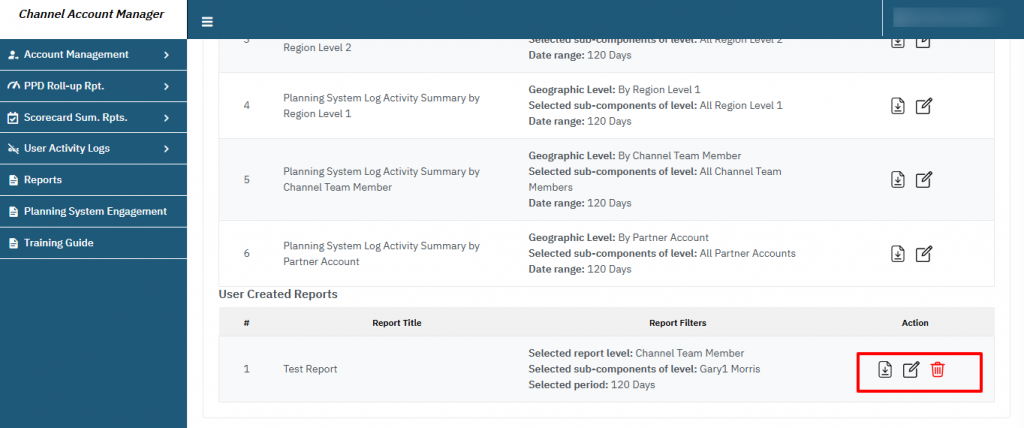
Managing Saved Reports #
View saved reports:
- Click View Saved Reports to access a list of pre-configured reports.

Edit or delete reports:
- Use the Edit or Delete icons to modify or remove a saved report.
FAQs #
Q1: What is the purpose of the “Add New Report” button? #
- It allows users to customize and generate reports based on specific parameters like region, period, and activity type.
Q2: Can I reuse a report configuration? #
- Yes, by saving the report, you can access it under “View Saved Reports” for future use.
Q3: What data range can I select for reports? #
- You can choose from predefined ranges like 7, 15, 30, 60, or 120 days, or customize the period.
Q4: What applications are included in activity tracking? #
- Common applications include:
- PPD (Partner Performance Dashboard)
- Goals & Action Plan
- Task Manager
- Partner Plan Acceptance
- Marketing Action Plan, etc.
- Channel Account Manager
- Partner Contact Summary
- Certifications/Parent Certs Status
- External Task Summary
- Question Response Profile
- Bus. Plan QBR Reports
- CAM Tracker
Q5: How can I filter the report? #
- Filters include:
- Report Level: By geographic region or team member hierarchy.
- Sub-components: Drill down to specific regions, CAMs, or partners.
Q6: What do the metrics like “New Planning System Entries” mean? #
- New Entries: Count of newly created planning activities.
- Updates: Modifications to existing entries.
- Deletions: Removed entries from the system.
- Page load: number of times a page was accessed.
- Exports: Data downloaded from the system.
Q7: Can I export my report? #
- Yes, all reports can be exported in Excel format for offline analysis.
- Use saved reports for consistent tracking and to reduce setup time.
